Inflation Comes in at 2.7%
Inflation Comes in at 2.7%
“It’s not what you don’t know that gets you into trouble.
It’s what you know for sure that just isn’t so.”
— Mark Twain
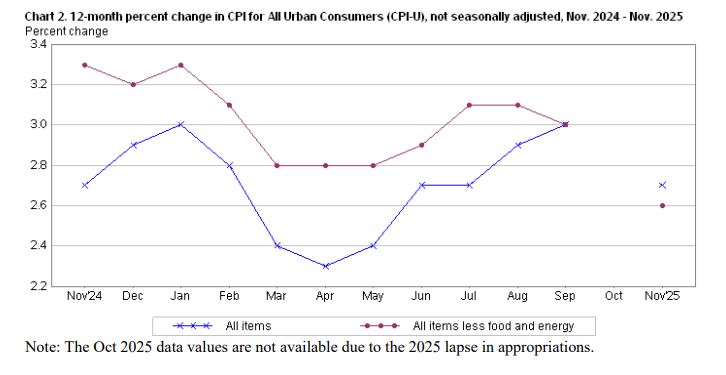
The U.S. Bureau of Labour Statistics is reporting that the Consumer Price Index for All Urban Consumers (CPI-U) was up 0.2% on a seasonally adjusted basis over the 2 months from September 2025 to November 2025. The all-items index was up 2.7% for the 12 months ending in November. The CPI’s food index increased 11.4% over the past year, the largest 12-month increase since the Carter years.

